The PyVisA application
PyVisA is the analysis and visualization tool for PyRETIS simulations. It consists of two components:
A compressor that reads raw simulation output, checks consistency, and stores the data in
pyvisa_compressed_data.hdf5.zip.A visualizer (GUI) that loads compressed or raw data and produces interactive plots, cluster analyses, and PCA results. The GUI has additional optional requirements, which must be installed separately (see installation).
The compressor and recalculation tools can run without a graphical environment. This is useful on remote clusters and other machines where Qt or an X display is not available. A common workflow is to prepare the compact PyVisA data on the remote machine and inspect it later on a local workstation with the GUI.
ChemiTrees and post-analysis
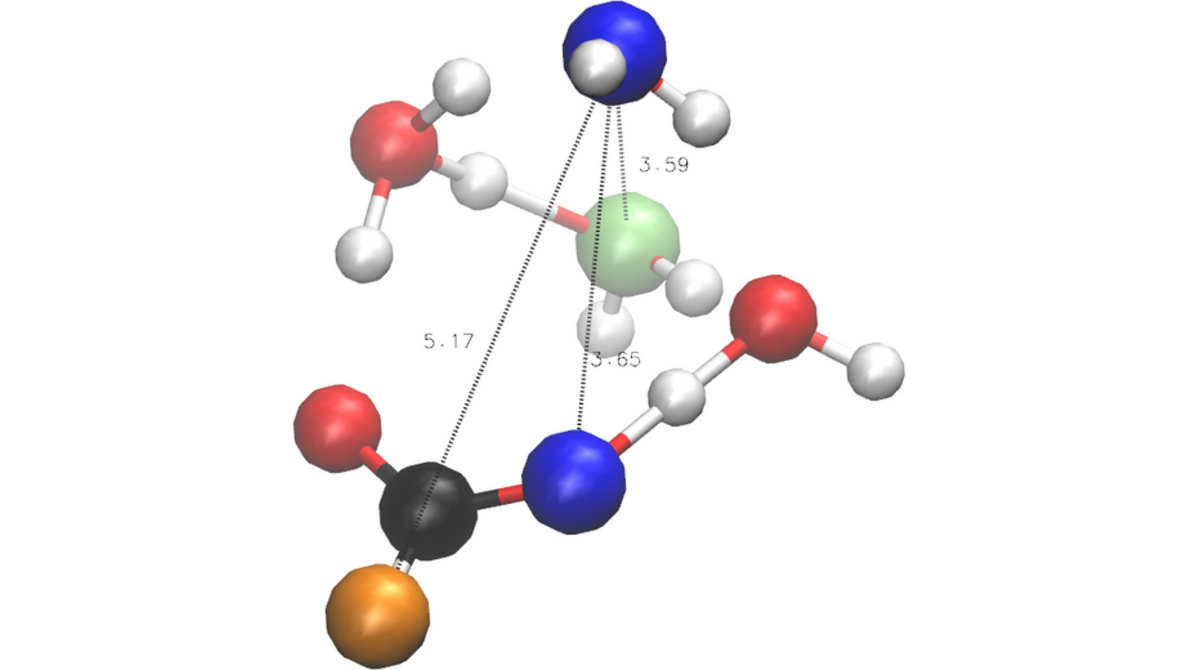
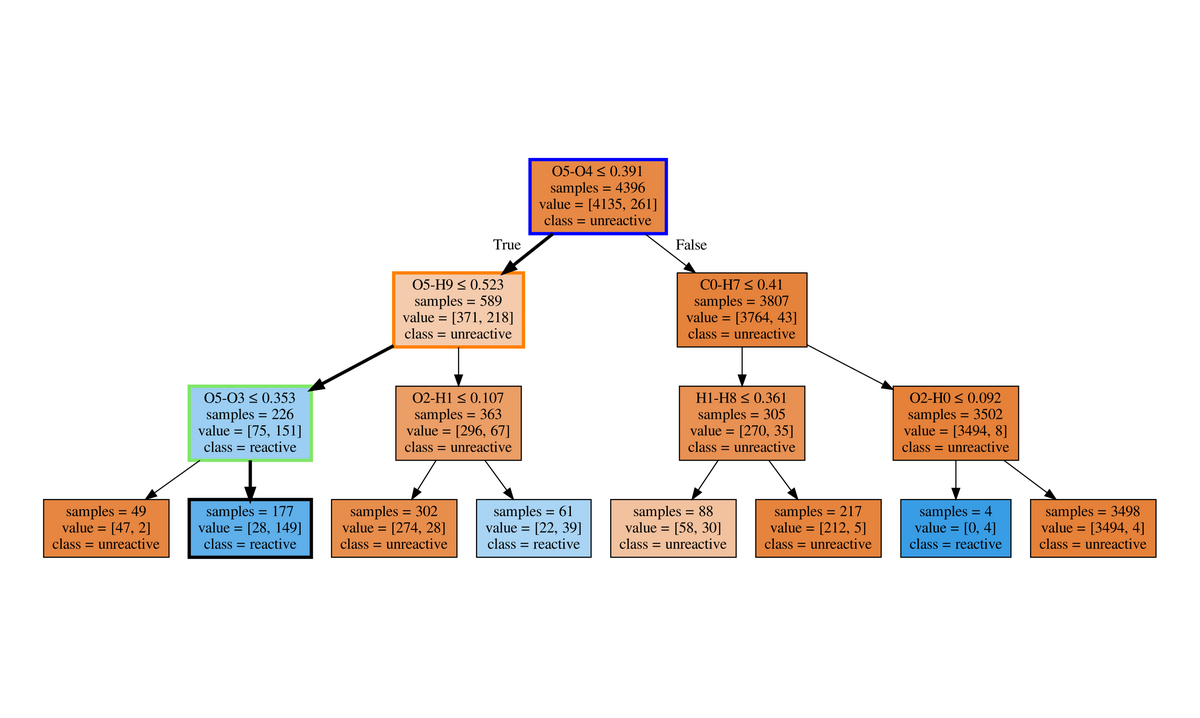
ChemiTrees are a post-analysis workflow for converting path-sampling trajectories into chemically interpretable decision trees. Instead of selecting a mechanism only by visual inspection, trajectory descriptors are classified into reactive and unreactive paths and the resulting tree identifies the geometric conditions that separate the two classes.
In the PyVisA workflow this belongs after compression and, when needed,
recalculation of order parameters or collective variables: create the
compact HDF5 data set, add the descriptors that matter for the system,
and then use the statistical-analysis routines to build decision-tree,
clustering or PCA views of the trajectory ensemble. The current API
entry point for the tree analysis is
pyretis.pyvisa.statistical_methods.decision_tree.
The ChemiTrees publication is listed in Main studies performed with PyRETIS. The corresponding reproduction input files are not yet mirrored on this website; they should be added there once the original data package has been recovered.
The general syntax is:
pyvisa [-h] [-i INPUT] [-V] [-cmp] [-data DATA] [-recalculate] [-oo] [-p] [-w N]
where the arguments are described in Table 50.
Flags can be freely combined: -recalculate and -cmp may be given
together to run recalculation followed by compression in one step.
If neither is set, the GUI is launched.
Choosing a workflow
The most common PyVisA workflows are:
Remote or headless use: run the compressor and, if needed, recalculation from the command line. This only writes files and does not open the GUI.
Local GUI use: install the GUI requirements and open either the compressed PyVisA file or the original simulation input file.
Remote GUI use: install the GUI requirements on the remote machine and run PyVisA through an environment that can show graphical applications, such as X11 forwarding or a remote desktop session.
Remote or headless usage
On a remote machine, first go to the completed simulation directory. This
is the directory containing the original PyRETIS input file and the
numbered ensemble folders such as 000, 001, and 002.
To compress the simulation output without opening the GUI, run:
pyvisa -i retis.rst -cmp
This creates pyvisa_compressed_data.hdf5.zip in the current
directory. The original simulation output is not modified.
If the remote machine should only package order parameter data, use:
pyvisa -i retis.rst -cmp -oo
The -oo option skips the energy files and can be useful when only the
order parameter and collective variable data are needed.
To recalculate order parameters or collective variables after changing
retis.rst or orderp.py, run:
pyvisa -i retis.rst -recalculate
The recalculation uses the trajectory files found in the simulation
directory and writes updated order.txt data. To limit the
recalculation to one trajectory file or a directory of trajectory files,
use -data:
pyvisa -i retis.rst -recalculate -data path/to/traj.xyz
pyvisa -i retis.rst -recalculate -data path/to/trajectory_folder
After recalculation, run the compressor again if you want a new compact file for transfer or later visualization:
pyvisa -i retis.rst -cmp
The remote environment needs the Python packages required to read the trajectory files and execute the order parameter code used by the simulation. The GUI dependencies are only needed when a PyVisA window will be opened.
Local GUI usage
Copy the compressed file from the remote machine to a local workstation where the PyVisA GUI requirements are installed:
scp user@remote.host:/path/to/simulation/pyvisa_compressed_data.hdf5.zip .
Then open it locally:
pyvisa -i pyvisa_compressed_data.hdf5.zip
You can also open the GUI directly from a simulation directory:
pyvisa -i retis.rst
or load a specific ensemble or data source:
pyvisa -i retis.rst -data 000
Direct remote GUI usage
Direct remote GUI usage is possible when the remote environment can show graphical applications. Install the GUI requirements on the remote machine, connect with display forwarding or a remote desktop session, and run PyVisA from the simulation directory:
pyvisa -i retis.rst
For large simulations this can be slower than the headless workflow, because the GUI must read the simulation data interactively over the remote session. Compressing remotely and opening the compressed file locally is usually the simpler workflow.
Example use
Compressor
Compress raw simulation output into
pyvisa_compressed_data.hdf5.zip:pyvisa -i out.rst -cmp
Compress using only order parameter files (faster, smaller output):
pyvisa -i out.rst -cmp -oo
Recalculate
Recalculate order parameters and collective variables:
pyvisa -i retis.rst -recalculate
Recalculate for a single ensemble only:
pyvisa -i retis.rst -recalculate -data 000
Recalculate with a progress bar and 4 parallel workers:
pyvisa -i retis.rst -recalculate -p -w 4
Combined flags
Recalculate and then compress in one step:
pyvisa -i out.rst -recalculate -cmp
Recalculate a single ensemble, then compress with order files only:
pyvisa -i out.rst -recalculate -data 000 -cmp -oo
Visualization GUI
Open the visualization GUI from a compressed file:
pyvisa -i pyvisa_compressed_data.hdf5.zip
Open the GUI from the original input file, loading a specific ensemble:
pyvisa -i out.rst -data 000
Open the GUI loading all data with order files only (faster):
pyvisa -i out.rst -oo
For a guided walkthrough of these features, see PyVisA: Visualization and analysis of path sampling results and Post-processing and visualization with PyVisA.
Input arguments
Argument |
Description |
|---|---|
|
Show the help message and exit. |
|
Location of the input file ( |
|
Show the version number and exit. |
|
Run the compressor tool to generate
|
|
Select a subset of data to load. Use |
|
Recalculate order parameter and collective variable data using
the current |
|
Use only data from |
|
Show progress bars during recalculation. |
|
Number of parallel worker processes for recalculation (default: all CPU cores). |
Visualisation and Analysis with PyVisA

PyVisA
Compress, inspect and visualise path-sampling trajectories from the tutorial suite.

PyVisA analysis
Add collective variables, run PCA and cluster trajectories from the methane-hydrate example.
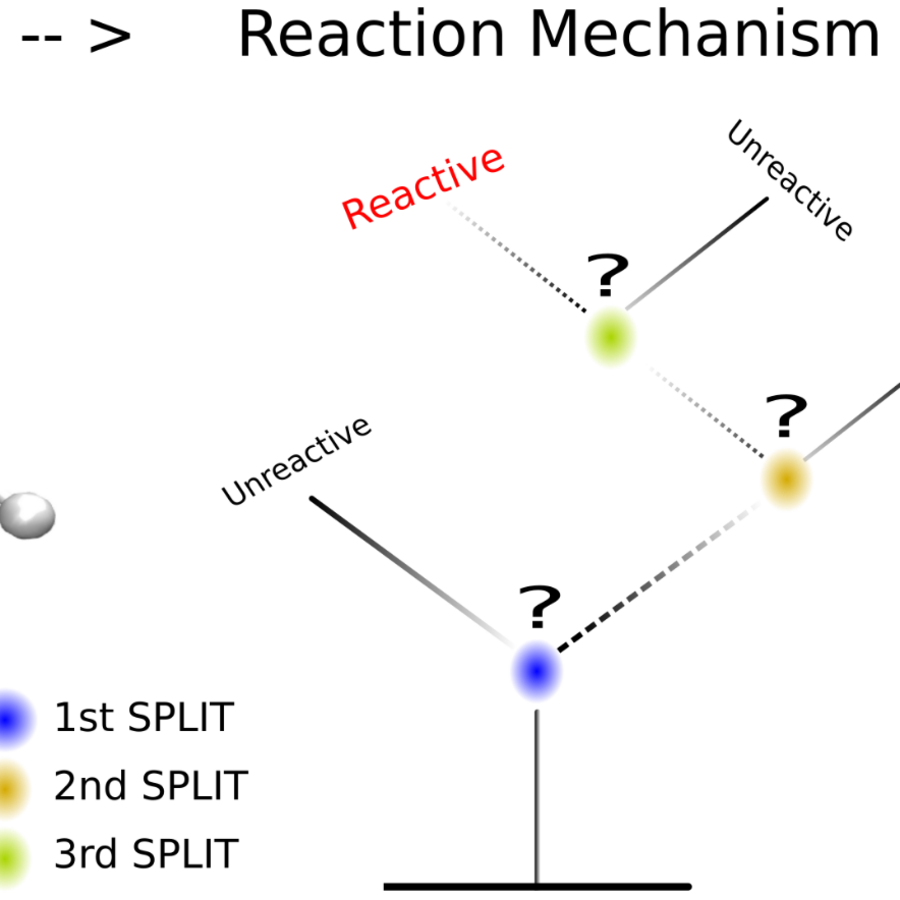
ChemiTrees
Use decision-tree post-analysis to identify molecular descriptors that distinguish reactive and unreactive path-sampling trajectories.